
With several new updates that will drive more powerful analysis, Cayuse Analytics now makes it easier for research leaders to gain visibility of their research portfolio and optimize results. For example, there’s powerful new filtering capability - by Proposal and Award Flags, Proposal Type, Award F&A Activity Type, Proposal Submitted Date, and many more.
When you log in to Cayuse Analytics, you can follow a guided tour by clicking the Take a tour button at the top of the page. The tour will walk you through the different types of charts within Analytics.
Using Filters
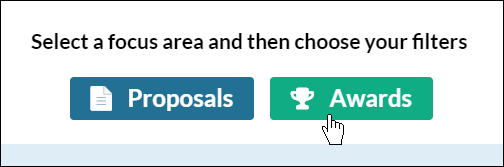
Within Analytics, you will see many filter fields that you can use to pare down the results in the charts beneath. You can select either Proposals or Awards above the fields.
Click into a field to begin filtering your results. When the side bar appears, click on an item to begin filtering.

You will see a Filtering message next to the charts on the page. Upon loading, the charts will display the data with the filters in place.
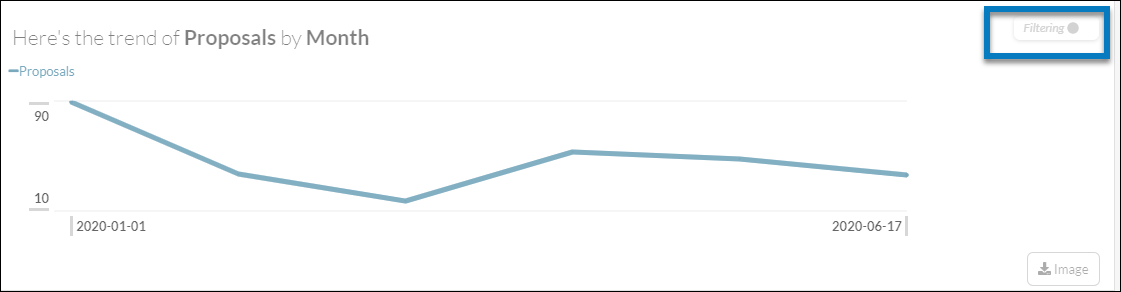
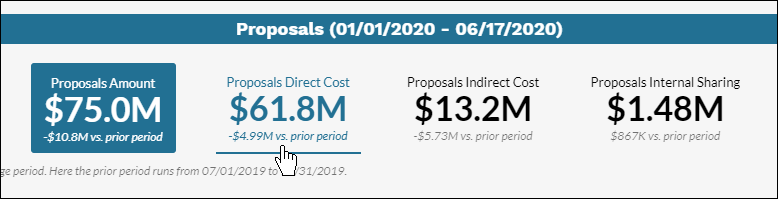
You can toggle between data points at the top of each chart or graph.

You can then carry your filters on to Trend or Detail Analysis, depending on the page you're on.
Click here to learn about the types of data brought into Analytics from Cayuse SP.